
TL;DR:
- Incident response ROI measures the financial benefits of security programs relative to their costs, emphasizing downtime avoidance, automation, and tool consolidation. Accurate modelling requires including fully-loaded labour costs, scenario ranges, and key operational metrics like MTTD, MTTA, and recurrence rate, validated by finance and operational stakeholders. Presenting ROI as a range and focusing on detection efficacy enhances credibility, continuous improvement, and the effectiveness of security investments.
Incident response ROI is defined as the measurable financial return generated by your security programme relative to its total implementation cost, calculated using the formula: (Financial Benefits minus Implementation Costs) ÷ Implementation Costs × 100. For CIOs and security leaders, this is not an abstract exercise. It is the foundation of every credible budget conversation you will have in 2026. The primary ROI levers are Mean Time to Resolve (MTTR) reduction of 30–50%, automation reclaiming engineering hours, and tool consolidation delivering hard savings. This calculate incident response roi guide walks you through each component, the formulas behind them, and the metrics that make your investment case defensible.
What inputs and metrics do you need to calculate incident response ROI?
Accurate ROI modelling starts with assembling the right financial inputs before you touch a formula. Missing one category, particularly labour costs, is the most common reason ROI calculations fail scrutiny from finance teams.
The three categories of financial benefit you must quantify are:
- Downtime cost avoidance. The revenue or productivity value recovered by resolving incidents faster. This requires your organisation's cost per hour of downtime, which varies significantly by sector and system criticality.
- Reclaimed engineering hours. Time your team no longer spends on manual tasks such as post-mortem documentation, alert triage, and status updates. Automating post-mortem documentation saves 75 minutes per incident. Across 200 annual incidents, that is 250 hours returned to productive work.
- Tool consolidation savings. The reduction in licence fees achieved by replacing multiple point solutions with a unified incident management platform.
On the cost side, you need implementation costs, annual licence or retainer fees, and internal onboarding time.
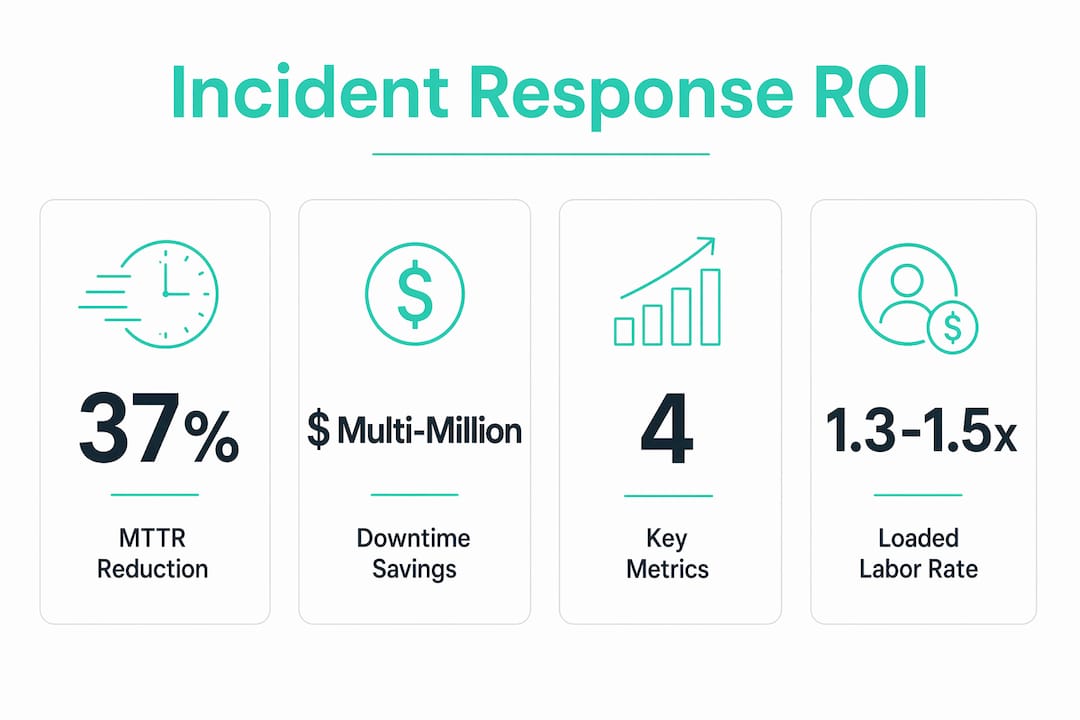
The four operational metrics that feed your model are Mean Time to Detect (MTTD), Mean Time to Acknowledge (MTTA), MTTR, and recurrence rate. Each metric maps directly to a financial benefit category. MTTR drives downtime cost avoidance. MTTA and MTTD drive detection efficacy value. Recurrence rate drives the cost of repeat incidents.

Pro Tip: Use a fully-loaded labour rate of 1.3x to 1.5x base salary when modelling engineer costs. A senior engineer on a £70,000 base costs your organisation approximately £100,000 fully loaded, once you include employer National Insurance, pension contributions, and overhead allocation. Using base salary alone will understate your true costs and overstate your ROI.
You should also factor in breach probability reduction as a benefit category. A well-structured incident response programme reduces the likelihood of a breach escalating to a reportable event. Industry modelling applies a breach probability reduction of approximately 40% as a weighting factor on potential breach costs, which can represent the largest single benefit in your model for organisations handling sensitive data.
How do you quantify the financial benefits of faster incident response?
Quantifying benefits requires moving from operational metrics to pound values. The following steps produce figures your CFO can interrogate.
- Calculate downtime cost avoidance. Use this formula: (Downtime cost per hour ÷ 60) × MTTR improvement in minutes × annual incident volume. For example, if your P1 downtime costs £5,000 per hour, your MTTR improves by 45 minutes, and you handle 40 P1 incidents per year, the annual saving is (£83.33 × 45) × 40 = £150,000.
- Calculate labour savings from automation. Multiply hours saved per incident by your fully-loaded hourly rate, then multiply by annual incident volume. If automation saves 1.25 hours per incident at a £48 fully-loaded hourly rate across 200 incidents, the saving is £12,000 per year.
- Calculate tool consolidation savings. List your current point solution licences that the new platform replaces. Subtract the new platform cost from the combined legacy spend. This is a hard saving, not an estimate, so treat it as your most defensible benefit figure.
- Apply scenario ranges. Build low, mid, and high estimates for each benefit category. Use conservative assumptions for the low scenario, your most likely figures for mid, and optimistic but plausible figures for high.
Pro Tip: Present your ROI to the board using all three scenarios. Scenario modelling improves finance and board engagement because it signals analytical rigour rather than advocacy. A single point estimate invites challenge; a range invites dialogue.
The table below shows a sample model for a mid-market organisation running 200 incidents per year.
| Benefit Category | Low Estimate | Mid Estimate | High Estimate |
|---|---|---|---|
| Downtime cost avoidance | £80,000 | £150,000 | £220,000 |
| Engineering time reclaimed | £8,000 | £12,000 | £19,000 |
| Tool consolidation savings | £15,000 | £22,000 | £30,000 |
| Total annual benefit | £103,000 | £184,000 | £269,000 |
A P1 MTTR reduction of 37% yields multi-million pound downtime savings for larger enterprises. For mid-market firms, the figures above are realistic and achievable within 12 months of deploying a unified incident management platform. Net benefits consistently exceed platform costs when all three categories are included.
Which effectiveness metrics validate your ROI assessment?
Metrics serve two purposes in an ROI model. They provide the input data for your financial calculations, and they demonstrate programme improvement over time to stakeholders who want evidence that the investment is working.
MTTA and MTTR indicate queue health and process bottlenecks. They are operational reliability metrics, not just performance statistics. A falling MTTR tells you your triage process is improving. A rising MTTA tells you your alerting or on-call routing has a problem.
The recommended starting set for most organisations is four metrics: MTTD, MTTA, time to contain, and recurrence rate. Starting with a small, trusted set of metrics prevents data overload and keeps your team focused on decisions rather than dashboards. Each of these four metrics maps to a distinct phase of the incident lifecycle, giving you coverage without redundancy.
Detection efficacy is the metric most frequently omitted from ROI assessments. It measures the percentage of incidents detected by your own controls versus those reported by external parties or customers. Balancing time-based metrics with detection efficacy avoids blind spots in your ROI evaluation. An organisation with a fast MTTR but a low detection rate is resolving incidents quickly after they are discovered, but missing many entirely. That gap represents unquantified risk that your ROI model must account for.
Layer your metrics reporting across three audiences. Operational teams need MTTD, MTTA, and MTTR at incident level. Tactical management needs trend data and recurrence rates by severity tier. Executive and board reporting needs financial impact summaries tied to the benefit categories in your model. Aligning metric presentation to audience prevents the common failure of presenting raw operational data to a board that needs business outcomes.
You can use your incident response SLA framework to set the performance thresholds that define acceptable MTTD, MTTA, and MTTR values. Those thresholds then become the baseline against which you measure improvement and calculate benefit.
What pitfalls should you avoid when modelling incident response ROI?
The most expensive mistakes in ROI modelling are not mathematical errors. They are structural omissions that undermine credibility when your numbers are tested.
- Ignoring fully-loaded labour costs. A 200-hour incident response effort costs approximately £6,000 in internal labour at a fully-loaded rate, not the £3,800 a base salary calculation would suggest. Using base salary understates your cost baseline and makes your ROI appear higher than it is. Finance teams will find this discrepancy.
- Presenting a single point estimate. A single figure is easy to challenge and hard to defend. Scenario ranges signal that you have tested your assumptions. They also give finance teams a conservative figure they can approve with confidence.
- Omitting detection efficacy from your benefits model. Time-based metrics alone create an incomplete picture. If your detection rate improves from 60% to 85%, that improvement has a financial value tied to incidents you now catch internally rather than learning about from customers or regulators.
- Tracking too many metrics. Limiting metrics to a few trusted ones prevents data overload and enhances decision-making. Teams that track 20 metrics rarely act on any of them with confidence.
- Skipping finance team validation. Your ROI model must survive a conversation with your CFO or finance business partner before it reaches the board. Build that review into your process, not as a final check, but as an iterative step that improves your assumptions.
"The goal of an incident response ROI model is not to produce the highest possible number. It is to produce the most credible number, one that holds up under scrutiny and builds lasting trust with the stakeholders who control your budget."
Reviewing your incident response readiness assessment before building your model gives you a structured baseline. It surfaces gaps in detection coverage and process maturity that directly affect which benefit categories are realistic for your organisation.
Key takeaways
Accurate incident response ROI requires combining downtime cost avoidance, fully-loaded labour savings, and tool consolidation into a scenario-ranged model validated by operational metrics and finance stakeholders.
| Point | Details |
|---|---|
| Use the standard ROI formula | Apply (Benefits minus Costs) ÷ Costs × 100, including breach probability reduction as a benefit weighting. |
| Load labour costs correctly | Apply a 1.3x to 1.5x multiplier to base salary to capture true engineer costs in your model. |
| Build three financial scenarios | Present low, mid, and high estimates to improve board credibility and invite dialogue rather than challenge. |
| Start with four core metrics | Track MTTD, MTTA, time to contain, and recurrence rate before adding any further operational measures. |
| Include detection efficacy | Pair time-based metrics with detection rate data to avoid blind spots that distort your ROI assessment. |
What we have learned building ROI cases for security leaders
The most common failure we see is not a wrong formula. It is a credibility gap. Security leaders present a single, optimistic figure to a board that has been burned by overpromised technology investments before. The number gets challenged, the conversation stalls, and the programme loses momentum.
The fix is not more data. It is better structure. Scenario ranges, fully-loaded costs, and finance team sign-off transform an advocacy document into an analytical one. That shift changes the dynamic in the room.
We have also seen organisations undervalue the detection efficacy improvement in their models. Resolving incidents faster is visible and measurable. Catching incidents you previously missed is harder to quantify but often represents a larger financial benefit, particularly for organisations subject to GDPR notification obligations or sector-specific regulatory penalties.
Automation and AI are changing the ROI calculus faster than most models account for. The 75-minute saving per incident from automated post-mortem documentation is already achievable today. As AI-assisted triage matures, the engineering hours reclaimed will grow, and the models built in 2026 will look conservative within two years. Build your model to be updated annually, not treated as a one-time exercise.
The organisations that get the most from their ROI modelling use it as a continuous improvement tool, not just a budget justification. Metrics that feed your model also tell you where your programme has the most room to improve. That alignment between financial reporting and operational improvement is where the real value sits.
— Makkari
How Makkarisecurity supports measurable incident response returns
Makkarisecurity's incident response and DFIR capabilities are built to deliver the speed and accuracy improvements that drive the financial benefits in your ROI model. Our proprietary forensic engine reduces dwell time and MTTR through live memory capture and cross-verified results, giving you the operational metrics that make your investment case concrete rather than theoretical.
The Eviction Pledge guarantees that once a threat actor is removed, they will not return for a minimum of 60 days, or you will not be charged. That guarantee is not a marketing claim. It is a contractual commitment backed by a flawless re-breach record across our client base in the UK, Gibraltar, and Europe. For organisations building a cyber incident financial impact model, that certainty has direct monetary value. Speak to our team to understand how our response capabilities translate into measurable ROI for your organisation.
FAQ
What is the standard formula for incident response ROI?
The standard formula is (Financial Benefits minus Implementation Costs) ÷ Implementation Costs × 100. Benefits should include downtime cost avoidance, reclaimed engineering hours, tool consolidation savings, and a breach probability reduction weighting of approximately 40%.
How do i calculate the labour cost of an incident response effort?
Multiply the hours spent on the incident by your fully-loaded hourly rate, which is 1.3x to 1.5x the engineer's base salary. A 200-hour effort at a fully-loaded rate equates to approximately £6,000 in internal labour cost.
Which four metrics should i track first when measuring incident response effectiveness?
Start with MTTD, MTTA, time to contain, and recurrence rate. These four metrics cover detection speed, response speed, containment quality, and programme improvement without creating data overload for your team.
Why should i present ROI as a range rather than a single figure?
Scenario modelling with low, mid, and high estimates improves credibility with finance teams and boards. A single point estimate is easy to challenge; a range demonstrates that you have stress-tested your assumptions and signals analytical rigour.
How does detection efficacy affect my incident response ROI model?
Detection efficacy measures the proportion of incidents your controls identify internally versus those reported externally. Improving this rate reduces regulatory exposure and breach escalation costs, making it one of the highest-value benefit categories in your model, particularly under GDPR.